

SAT for highways
Traffic counting and classification with your highway cameras
SAT, the Omnivias camera-based Traffic Analysis System (the automatic traffic sensor, in the terminology of ARTESP and ANTT, Brazil’s state and federal transport regulators), turns video from highway cameras into counts by class, axles, speed, density and HCM parameters, continuously, for operations, engineering, regulation and planning, without installing sensors in the pavement.
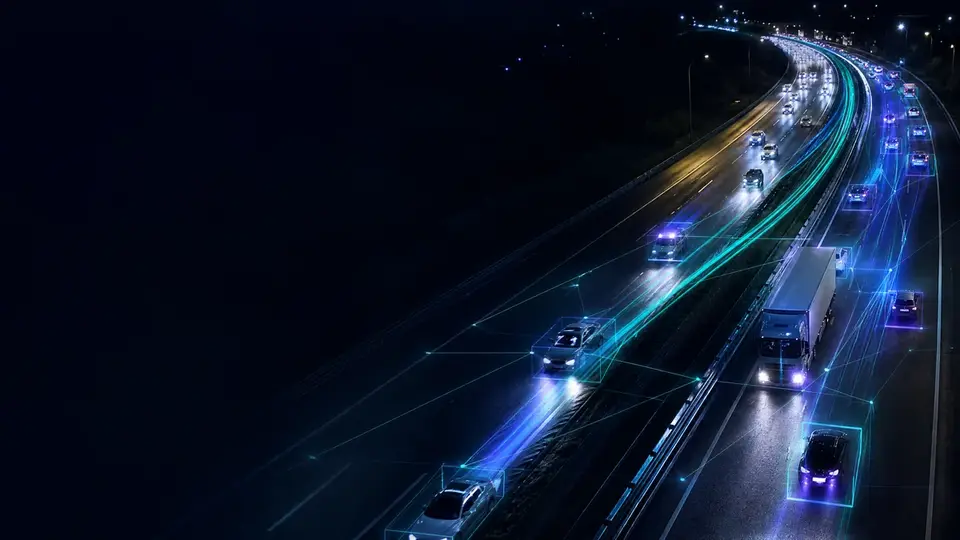
| Vehicles | 412 |
|---|---|
| Trucks | 23% |
| V85 speed | 97 km/h |
| Density | 9 veh/km/lane |
What SAT measures
Each project is calibrated to the camera, the scene, the operational requirements and the validation criteria.
Traffic volume
Counts by camera, lane, direction, road section and period.
Vehicle classification
Cars, trucks, buses, motorcycles and other classes defined in the project: classified volumetric counting.
Axles and attributes
Axle counts and vehicle attributes in technically validated scenes.
Speed and V85
Spot speed, average speed, percentiles and indicators for operational analysis.
HCM parameters
Flow rate, density, occupancy, headway and other capacity parameters.
Maps and history
Heat maps, rankings, trends and comparisons by road section.
What each reading is for
Volume on its own says little. The value appears when indicators are read together, over the same window of time and space.
Density and flow rate, combined, describe the state of a road section better than average speed: two sections with the same average speed can be in opposite conditions. Occupancy usually signals saturation before speed drops, and headway links capacity and safety.
V85 is the reference engineering and regulators use to discuss signage and speed limits, because it describes actual driver behavior. When this reading becomes continuous, it turns into a time series, and that is what shows whether an intervention worked.
| Dimension | Inductive loop | Omnivias SAT |
|---|---|---|
| Installation | Work on the pavement | Uses existing CCTV |
| Information | Data from a single physical point | Counts, trajectory, class, speed and visual context |
| Maintenance | Wear and roadworks | Remote updates and calibration |
| Validation | Depends on sensor and installation | Depends on camera, scene and regulatory requirement |
Full comparison: Camera-based SAT or inductive loops?
From diagnosis to production
A technical, traceable process driven by the highway’s objectives.
Objectives
Mapping of objectives, cameras and priority road sections.
Diagnosis
Image, positioning, lighting and connectivity.
Calibration
Geometric calibration and model tuning.
Validation
Field comparison against the agreed reference.
Production
Dashboards, reports and integrations.
Quality
Monitoring and recalibration when the scene changes.
Continuous calibration
A computer vision model is not delivered finished and left running. Models and criteria evolve with the real conditions at each site: camera height and angle, distance to the road section, lighting throughout the day, reflections on wet pavement and pole stability.
Calibration makes the effect of severe conditions predictable and documented: operations know under which conditions each site performs within the agreed criterion. In projects in production, counting accuracy runs above 95% against the field reference.
Before the pilot: a checklist to find out whether your camera qualifies.
Data, reports and integration
- Operational reports: the day-to-day picture of the road section.
- Analytical reports: time series and comparisons across periods, sections or directions.
- Regulatory reports: views defined by the contract or the regulator.
- Calculation records: every indicator can be traced back to its source.
- APIs and webhooks: the data feeds the concessionaire’s systems.
Start with a pilot on your own cameras
First we assess the cameras the highway already has; then a proof of concept using footage from the road section itself shows the measured result. Depending on the size of the project, the assessment and the proof of concept can be free of charge, and the proof of concept starts running within 10 days of signing the agreement.
Assessment
Resolution, position, coverage, lighting and network of the existing cameras, against what the operation wants to measure and detect.
Proof of concept
SAT and DAI running on footage from the road section itself, measured against the agreed success criteria.
Production
On-premises, cloud or hybrid architecture, control center integration, rules, alerts and reports.
Continuous calibration
Rules and models tuned camera by camera using the real alert history.
SAT frequently asked questions
What is Omnivias SAT?
SAT is the Omnivias camera-based Traffic Analysis System, the automatic traffic sensor in ARTESP and ANTT terminology. It uses computer vision to turn video into counts, vehicle classes, axles, speed, density, HCM indicators, dashboards and reports.
What is classified volumetric counting?
It is a vehicle count broken down by class (cars, trucks, buses, motorcycles and other classes defined in the project), by lane, direction and period. SAT does this counting continuously using the highway’s cameras.
Does SAT require sensors in the pavement?
No. SAT uses the existing CCTV and produces data without installing loops or other sensors on the road, depending on image quality and project validation.
Does SAT replace inductive loops?
In many projects, yes. Computer vision produces counts, classification, speed and other data with no sensors in the pavement. Where specific metrological requirements apply, both methods can work side by side.
How accurate is SAT?
In projects in production, counting accuracy runs above 95% against the reference agreed in the field. The acceptance criterion is defined per project, together with operations, before going live.
What reports does SAT produce?
Data by camera, lane, direction, road section and period, with operational, analytical and regulatory reports defined by the project requirements, plus calculation records.
Does SAT work at night and in the rain?
Yes, with specific calibration. Severe conditions reduce visibility for any optical system, so models and rules are tuned for lighting, contrast and reflections.
Can SAT and DAI use the same camera?
Yes. The same image feeds SAT traffic analysis and DAI incident detection, with no duplicated infrastructure.
Assess SAT on your infrastructure
Talk to the Omnivias team about cameras, road sections, volume, classes, indicators and regulatory requirements.
- Phone and WhatsApp
- +55 11 3636-8989
- Address
- São Paulo, SP, Brasil